RCM
Key RCM Metrics Every Provider Should Track
What’s Included
- Clean Claim Rate
- Denial Rate
- Net Collection Rate
- Days in Accounts Receivable (A/R)
- Patient Collection Rate
- Cost to Collect
Featured Post
The Top Denial Reasons by Insurance Payers and How to Boldly Outsmart Them
If you can’t measure it, you can’t manage it. This old business adage is especially true for healthcare revenue cycle management, where the difference between tracking the right metrics and flying blind can mean hundreds of thousands in lost revenue.
Too many healthcare providers operate their practices based on gut feelings and outdated reports. They wait until cash flow problems hit to realize their RCM in medical billing processes is failing. By then, it’s often too late to prevent serious financial damage.
What is Revenue cycle management metrics
Successful healthcare practices rely on data-driven decision making, and revenue cycle management metrics are the compass that guides financial performance. These key performance indicators reveal exactly where your practice stands financially and where immediate attention is needed.
By the end of this post, you’ll understand which RCM metrics matter most, how to calculate them, what benchmarks to target, and what actions to take when metrics fall below industry standards. You’ll transform from reactive crisis management to proactive revenue optimization.
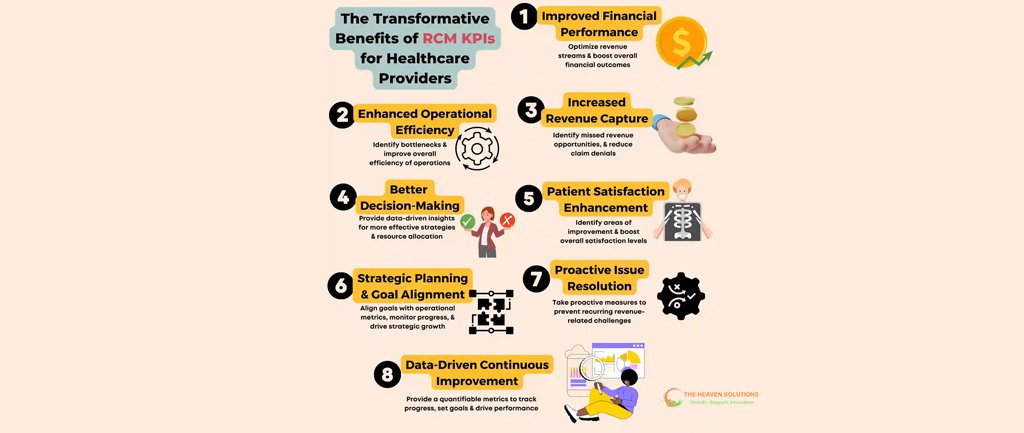
Why Tracking RCM Metrics Is Non-Negotiable
Revenue cycle management isn’t just about submitting claims and collecting payments. It’s about creating a systematic approach to maximizing every dollar your practice earns while minimizing the cost and time required to collect it. RCM metrics provide the roadmap to achieve this goal.
Healthcare revenue cycle management metrics
serve as early warning signs of revenue leakage before it becomes a cash flow crisis. A declining clean claim rate today predicts payment delays next month. Rising denial rates signal systemic problems that will compound over time if left unaddressed.
Data-driven practices consistently outperform those relying on intuition alone. Practices that track revenue cycle KPIs monthly report 15-25% higher collection rates than those that only review financial performance quarterly or annually. They identify problems faster, implement solutions quicker, and maintain more stable cash flows.
Benchmarking against industry standards helps identify improvement opportunities and competitive advantages. When you know your net collection rate is 88% while the industry average is 95%, you’ve identified a specific area worth immediate investment and attention.
Regular RCM metrics tracking enables proactive problem-solving rather than reactive crisis management. Instead of discovering a cash flow shortage when rent is due, you spot the trend weeks in advance and take corrective action.
Finally, metrics help justify investments in technology, staff training, or process improvements to stakeholders. When you can demonstrate that upgrading your RCM systems will improve your clean claim rate from 85% to 95%, the ROI calculation becomes clear and compelling.
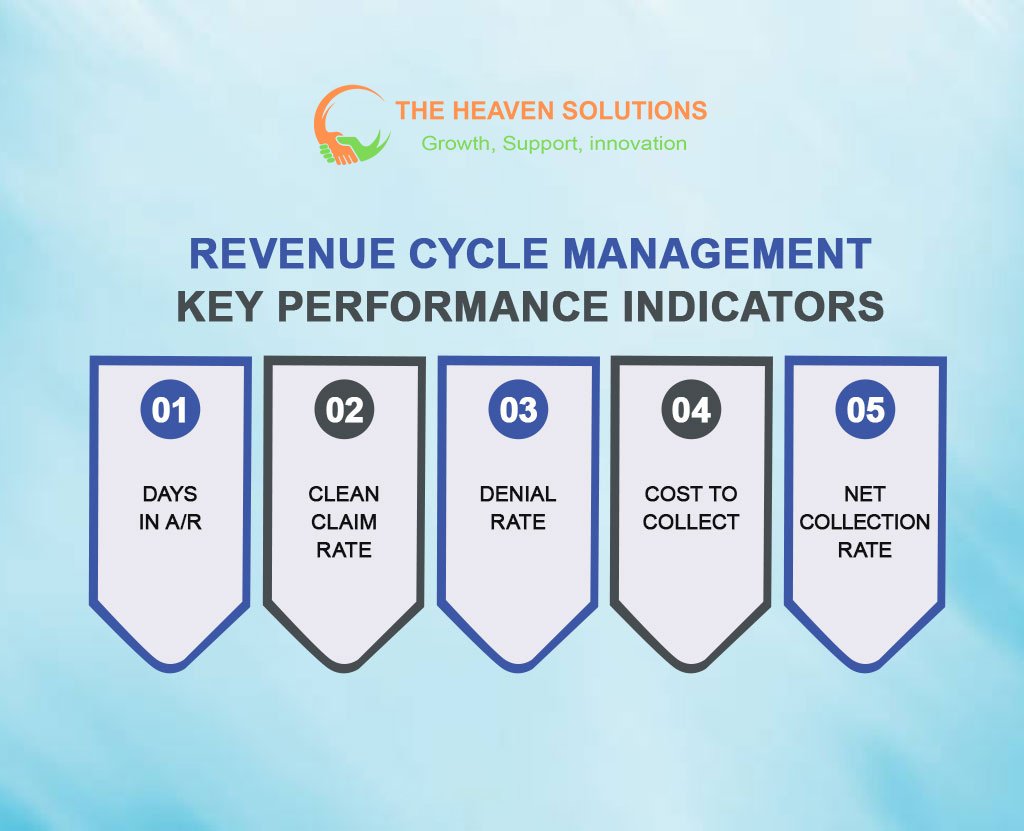
7 Critical Metrics to Track
Just as physicians monitor vital signs to assess patient health, practice owners must monitor these seven critical revenue cycle management metrics to assess financial health.
1- Clean Claim Rate
Your clean claim rate measures the percentage of claims submitted without errors that can be processed by the payer’s system without manual intervention. This is arguably the most important RCM metric because it directly impacts how quickly you get paid.
Calculation: (Number of clean claims submitted / Total claims submitted) × 100
Industry Benchmark: 95% or higher
Impact: Clean claims are typically paid within 14-21 days. Claims with errors can take 30-90 days or more to resolve, creating significant cash flow delays. A practice submitting 1,000 claims monthly with an 85% clean claim rate versus 95% experiences 100 additional delayed payments each month.
The financial impact extends beyond delayed payments. Each claim error requires staff time to research, correct, and resubmit. This increases your cost to collect and reduces overall practice efficiency.
2- Days in Accounts Receivable (A/R)
Days in A/R measures how long it takes to collect payment after providing services. This metric reveals the efficiency of your entire revenue cycle process.
Calculation: (Total A/R balance / Average daily charges) = Days in A/R
Industry Benchmark: 30-40 days for most specialties
Cash Flow Impact: Every additional day in A/R represents money you’ve earned but haven’t collected. A practice with $50,000 in monthly charges averaging 50 days in A/R has $83,333 in outstanding receivables. Reducing this to 35 days would decrease outstanding receivables to $58,333, improving cash flow by $25,000.
Practices with days in A/R exceeding 50 typically have systemic problems in their medical billing RCM processes that require immediate attention.
Calculation: (Number of clean claims submitted / Total claims submitted) × 100
Industry Benchmark: 95% or higher
Impact: Clean claims are typically paid within 14-21 days. Claims with errors can take 30-90 days or more to resolve, creating significant cash flow delays. A practice submitting 1,000 claims monthly with an 85% clean claim rate versus 95% experiences 100 additional delayed payments each month.
The financial impact extends beyond delayed payments. Each claim error requires staff time to research, correct, and resubmit. This increases your cost to collect and reduces overall practice efficiency.
3- Net Collection Rate
Your net collection rate measures what percentage of collectible revenue you actually collect. This is the ultimate measure of revenue cycle management effectiveness.
Calculation: (Total payments collected / Total collectible charges) × 100
Industry Benchmark: 95-98%
Performance Indicator: This metric reveals the overall health of your healthcare revenue cycle. Rates below 90% indicate serious problems in multiple areas, from claims processing to patient collections. Rates above 98% suggest exceptional RCM management.
Factors that influence net collection rate include clean claim rates, denial management effectiveness, patient collection strategies, and contract negotiation success with payers.
4- Denial Rate
Your denial rate measures the percentage of submitted claims that payers initially reject or deny. This metric identifies problems in your medical billing revenue cycle processes.
Calculation: (Number of denied claims / Total claims submitted) × 100
Industry Benchmark: 5-10%
True Cost Impact: The cost of denials extends far beyond just the claim value. Each denial requires staff time to research the reason, gather additional documentation, correct errors, and submit appeals. Studies show that processing a denial costs practices $25-40 per claim in administrative expenses.
A practice with a 15% denial rate versus 5% spends significantly more on administrative costs while experiencing delayed payments and reduced cash flow.
5- First-Pass Resolution Rate
Your first-pass resolution rate measures the percentage of claims paid on first submission without requiring any follow-up, appeals, or additional documentation.
Calculation: (Claims paid on first submission / Total claims submitted) × 100
Efficiency Connection: This metric directly correlates with practice productivity. Higher first-pass resolution rates mean less time spent on follow-up activities and more time available for patient care or practice growth initiatives.
Practices achieving first-pass resolution rates above 90% typically have superior RCM systems and well-trained staff who understand payer requirements thoroughly.
6- Cost to Collect
Cost to collect measures how much you spend to collect each dollar of revenue. This metric helps evaluate the efficiency of your revenue cycle management processes.
Calculation: (Total RCM-related expenses / Total collections) × 100
Industry Benchmark: 2-5% of collections
Efficiency Indicator: Practices with cost-to-collect ratios above 8% typically have inefficient processes or inadequate technology. Those below 3% often have optimized healthcare RCM systems and processes.
7- Patient Collection Rate
Patient collections have become increasingly important as high-deductible health plans shift more financial responsibility to patients.
Calculation: (Patient payments collected / Total patient responsibility) × 100
Benchmark: 85-95% depending on practice specialty and patient population
Strategy Impact: Practices with effective financial counseling, upfront collection processes, and flexible payment options typically achieve higher patient collection rates.
How to Improve Your RCM Performance
Tracking revenue cycle management metrics is only valuable if you take action to improve underperforming areas. Here are proven strategies for optimizing each critical metric.
1- Clean Claim Rate Improvement
Implement pre-submission claim scrubbing technology as part of your RCM software suite. These tools automatically check claims against payer edits and identify errors before submission, dramatically improving clean claim rates.
Invest in staff training on coding accuracy and documentation requirements. Regular training sessions keep your team current with coding updates and payer-specific requirements. Consider certifying key staff members in relevant coding specialties.
Use real-time eligibility verification for every patient encounter. Verify insurance coverage, benefits, copays, and deductibles before providing services. This prevents claims denials due to coverage issues and improves the patient’s financial experience.
2- A/R Acceleration
Establish systematic follow-up schedules based on claim age and payer type. Create written protocols that specify exactly when and how to follow up on unpaid claims. Track follow-up activities in your practice management system.
Implement aging report management processes. Run A/R aging reports weekly and assign specific team members to work claims in different aging categories. Prioritize older claims that are approaching timely filing deadlines.
Automate payment posting where possible. Electronic remittance advice (ERA) and automated payment posting reduce the time between receiving payments and updating patient accounts.
3- Collection Rate Optimization
Provide patient financial counseling before services are rendered. Train front desk staff to discuss patient responsibility, collect copays and deductibles upfront, and offer payment plan options for larger balances.
Implement upfront collection strategies. Studies show that collecting patient responsibility at the time of service improves collection rates by 70% compared to billing patients after services are provided.
Offer flexible payment plan options for patients with larger balances. Many patients are willing to pay if given reasonable payment terms. Consider partnering with patient financing companies for larger balances.
4- Denial Prevention and Management
Conduct root cause analysis of denial patterns. Track denial reasons by payer, provider, and service type. Identify trends and implement targeted solutions for the most common denial causes.
Create appeals management protocols with clear timelines. Most payers require appeals within 90-120 days of denial. Missing these deadlines converts potentially collectible claims into permanent write-offs.
Build stronger payer relationships. Regularly communicate with payer representatives to understand policy changes, prior authorization requirements, and appeals processes. This knowledge helps prevent denials and expedite appeals.
5- Technology Solutions
Optimize your practice management system for revenue cycle efficiency. Ensure your system supports claim scrubbing, automated eligibility verification, and comprehensive reporting. Many practices underutilize their existing system capabilities.
Consider RCM software integration if your current system lacks advanced features. Modern revenue cycle management systems offer sophisticated analytics, automated workflows, and integration capabilities that can dramatically improve performance.
Implement reporting dashboards that display key RCM metrics in real-time. Visual dashboards help staff quickly identify problems and track improvement progress. Regular visibility of metrics encourages consistent performance.
Maximized Revenue and Improved Cash Flow
Our core mission is to ensure you are paid fully and promptly for the services you provide. Through expert coding and aggressive denial management, we significantly increase your clean claim rate. This means more of your claims are approved on the first submission. Furthermore, our diligent A/R follow-up works to reduce days in accounts receivable. The result is a more predictable and robust cash flow.
Reduced Operational Costs and Increased Focus
Maintaining an in-house billing team comes with significant overhead, including salaries, benefits, training, and software licenses, which all add up. When you outsource revenue cycle management, you eliminate these expenses. More importantly, it frees up your most valuable asset: your time. When billing complexities no longer bog down your staff, you can redirect your energy toward what you do best: providing outstanding patient care and pursuing strategic growth.
Taking Control of Your Practice's Financial Future
Understanding and tracking key performance indicators for healthcare revenue cycle transforms practice management from reactive problem-solving to proactive optimization. These seven critical metrics provide the insights needed to maximize revenue, minimize costs, and maintain healthy cash flow.
Revenue cycle management KPIs
The practices that thrive in today’s challenging healthcare environment are those that embrace data-driven decision making. They track revenue cycle management KPIs consistently, benchmark against industry standards, and take immediate action when metrics indicate problems.
Remember that RCM metrics are interconnected. Improving your clean claim rate reduces denials, which accelerates A/R collections, which improves cash flow and reduces collection costs. Small improvements in each area compound to create significant financial benefits.
Start by establishing baseline measurements for each metric. Track them monthly and compare against industry benchmarks. Set improvement targets and implement specific strategies to achieve them. Most importantly, make revenue cycle optimization an ongoing priority, not a one-time project.
Ready to transform your practice’s financial performance? Contact The Heaven Solutions today for a comprehensive RCM assessment and customized improvement plan. Our experts will analyze your current metrics, identify opportunities for optimization, and implement proven strategies to maximize your revenue cycle efficiency. Don’t let poor metrics drain your practice’s profitability. Take action today.